Trout Power
advocacy. stewardship. citizen science.
Genetic Data and Results
Background:
Over the past decade, Trout Power has worked to identify the genetic diversity of brook trout and continues to search for more. By mapping the diversity of brook trout genes in the Adirondack park, we hope to show the current snapshot of brook trout populations.
The NYSDEC has had an active stocking program of brook trout beginning in 1879-1880. Over the past 145+ years continuous stocking has led to intra-specific breeding with native populations of fish by mixing the genetics and creating hybrids of stocked and native DNA.
Methods for analysis:
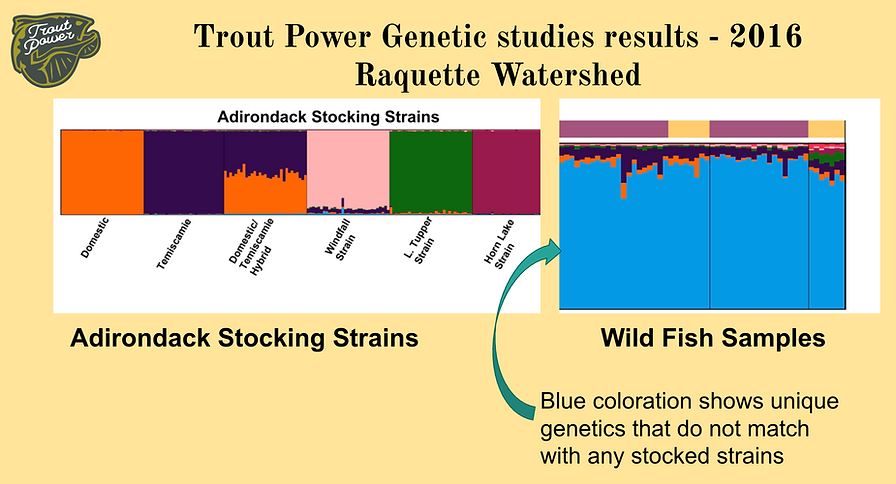
For our analysis, Trout Power compares the DNA of fish sampled in the field to the 6 known "strains" of brook trout that are stocked within the park: Domestic, Temiscamie, the Domestic Temiscamie hybrid, Horn, Little Tupper and Windfall strains.
The field samples are also compared to prior field samples to look for genetic relatedness. All of this work is completed at various University Labs.
In 2016-2019 Trout Power used microsatellite analysis for our genetic analysis.
From 2020 to present Trout Power uses radseq analysis which provides even more genetic detail for comparative analysis.
How do I read the bar plots below that show the results?
Reading these data sets is a visual comparative analysis. In each data set, the 6 stocked strains are represented by their own unique color. Each vertical bar is an individual fish. In the Trout Power sampled fish, any color that does not match with those of the stocked strains, shows a unique genetic signature. In the case of a fish showing mutiple colors, that shows genetic hybridization amongst populations.
What are the major takeaways from these results?
With any form of scientific data, there is opportunity for analysis, inference, and more questions. One key takeaway is that there is a tremendous amount of genetic variety in the brook trout that currently occupy the Adirondack park. Almost every area Trout Power has sampled has shown unique genetics. These genetics have evolved over hundreds, if not thousands, of years and are critically important for the long term well being of the species. Protecting these wild genetics in tact give these fish the best chance at survival through the future challenges they will face.
Trout Power Results Overview 2016 - 2024